| Risk/Reward Statistics | |
|---|---|
| Sharpe Ratio | 0.13 |
| Sortino Ratio | 0.19 |
| Omega Ratio | 0.18 |
| Skewness | -0.36 |
| Kurtosis | 1.74 |
| Risk Statistics | |
|---|---|
| Annualized Std.Deviation | 18.42 |
| Maximum Drawdown | 72.98 |
| Month to Recover | 140.00 |
| Worst Month | -26.04 |
| Losing Months (%) | 44.25 |
| Average Losing Month | -4.26 |
| Loss Deviation | 3.68 |
| Return Statistics | |
|---|---|
| Last Month | 0.17 |
| Year To Date | 0.17 |
| 3 Month ROR | 6.92 |
| 12 Month ROR | 6.47 |
| 36 Month ROR | 7.50 |
| Total Return | 99.72 |
| Compound ROR | 2.41 |
| Best Month | 20.12 |
| Winning Months (%) | 55.75 |
Time Window Analysis:
| 1 Month | 3 Month | 6 Month | 1 Year | 2 Year | 3 Year | 5 Year | |
|---|---|---|---|---|---|---|---|
| Best | 20.12 | 24.44 | 43.92 | 79.12 | 107.06 | 145.77 | 218.54 |
| Worst | -26.04 | -43.34 | -56.88 | -52.60 | -55.86 | -55.96 | -57.82 |
| Average | 0.34 | 1.14 | 2.40 | 5.15 | 10.85 | 15.76 | 30.65 |
| Median | 0.65 | 1.86 | 2.84 | 2.89 | 5.95 | 8.75 | 8.53 |
| Last | 0.17 | 6.92 | 3.80 | 6.47 | -3.27 | 7.50 | -11.20 |
| Winning (%) | 55.75 | 56.07 | 58.60 | 57.86 | 56.31 | 57.51 | 59.17 |
| Avg. Pos. Period | 3.99 | 8.08 | 12.29 | 21.06 | 35.60 | 44.53 | 70.18 |
| Avg. Neg. Period | -4.26 | -7.71 | -11.59 | -16.70 | -21.03 | -23.16 | -26.64 |
| # Of Periods | 348.00 | 346.00 | 343.00 | 337.00 | 325.00 | 313.00 | 289.00 |
Drawdown Report:
| Depth (%) | Length (Months) | Recovery (Months) | Start | End |
|---|---|---|---|---|
| -72.98 | 140 | NA | 2008-07-31 | NA |
| -50.12 | 44 | 18 | 1997-01-31 | 2000-08-31 |
| -28.29 | 26 | 12 | 2000-12-29 | 2003-01-31 |
| -25.37 | 53 | 24 | 1991-11-29 | 1996-03-29 |
| -17.42 | 15 | 9 | 2006-08-31 | 2007-10-31 |
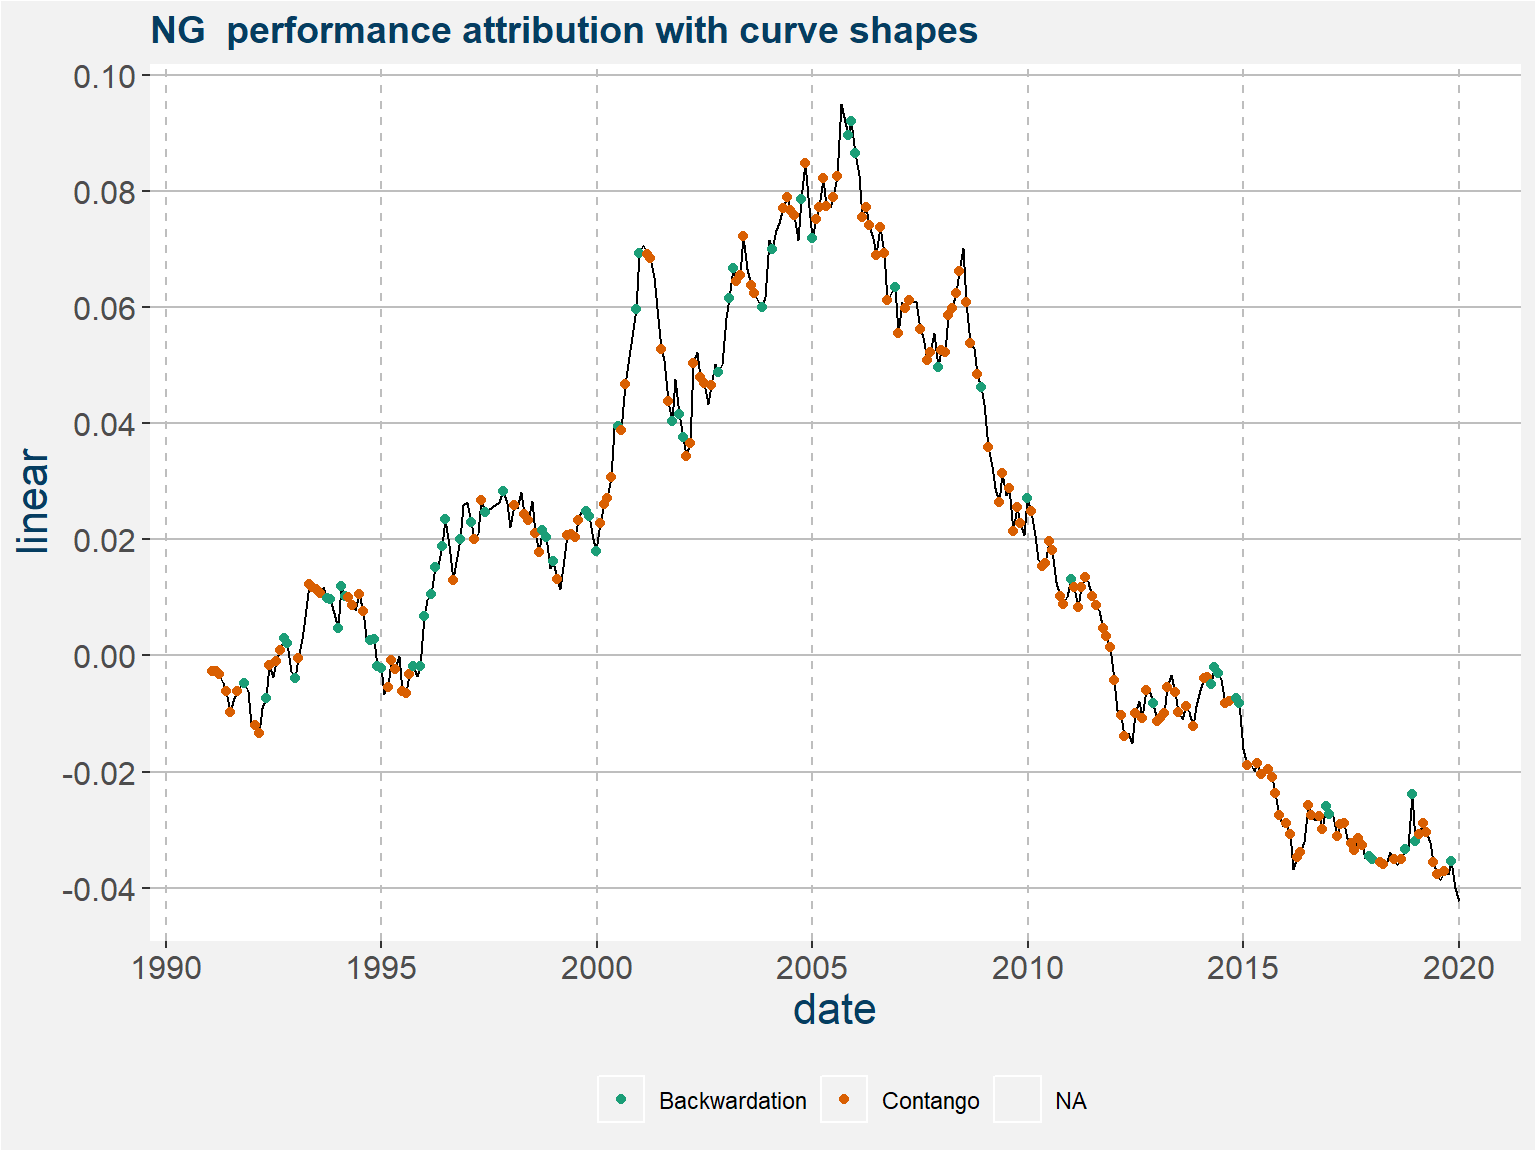
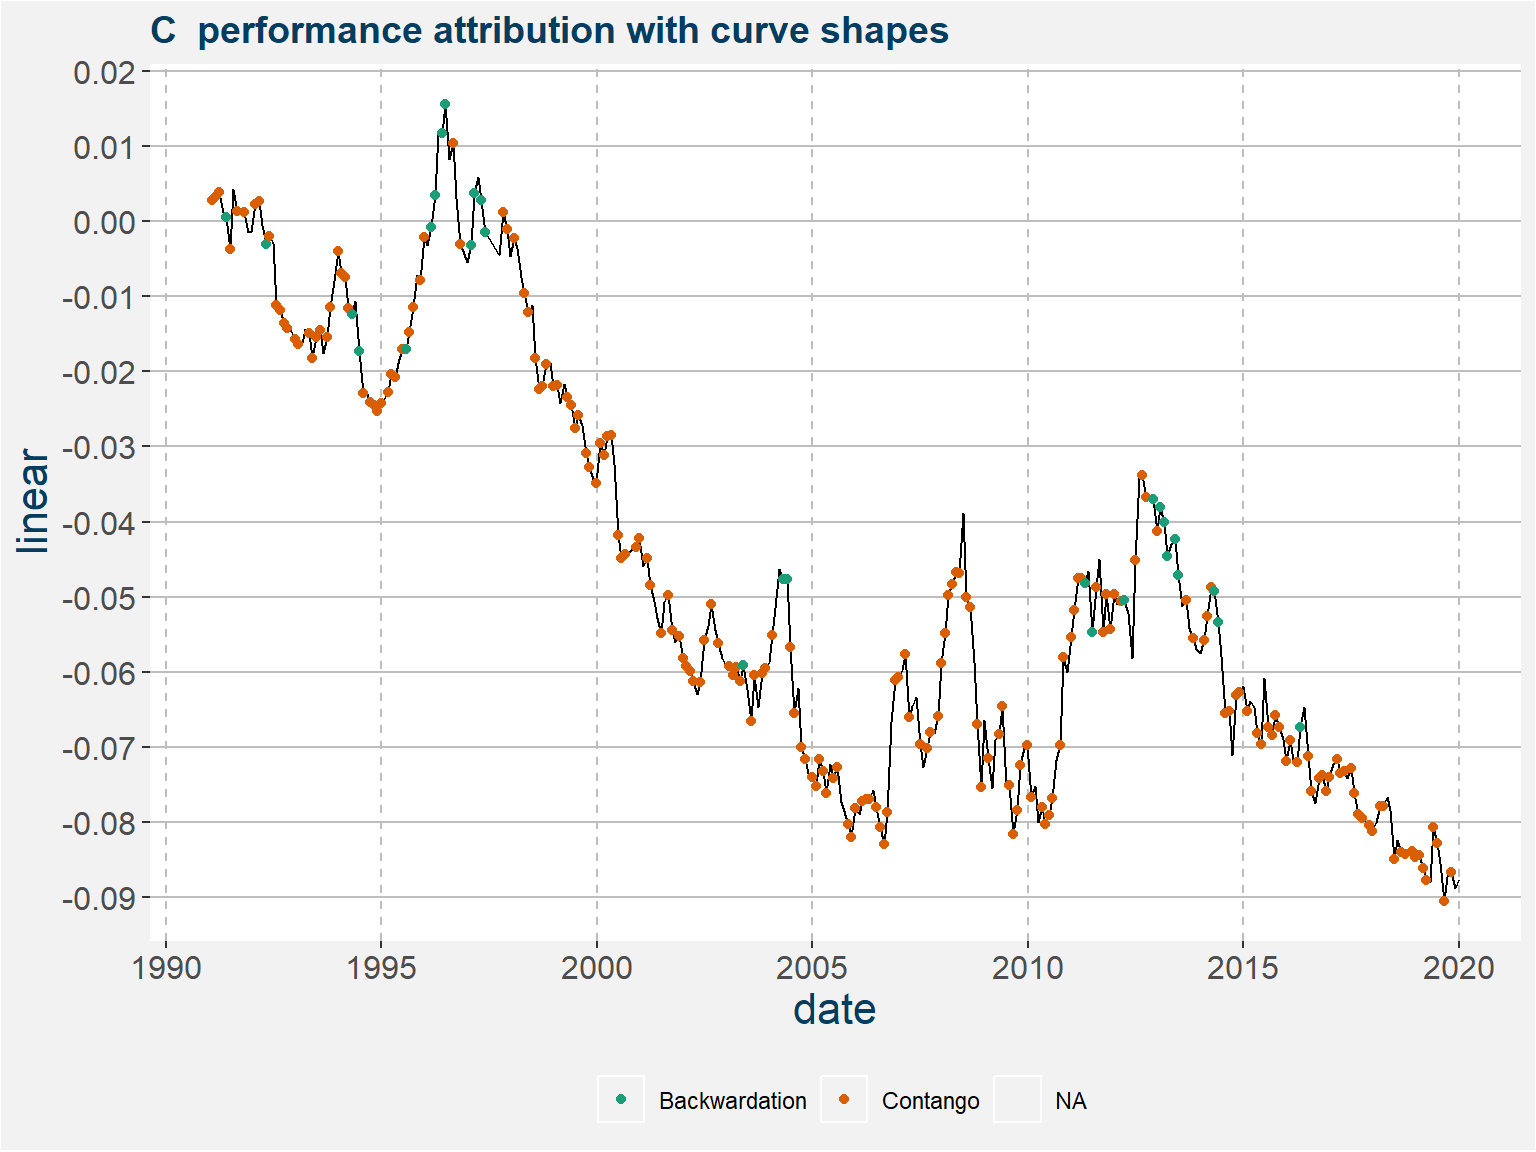
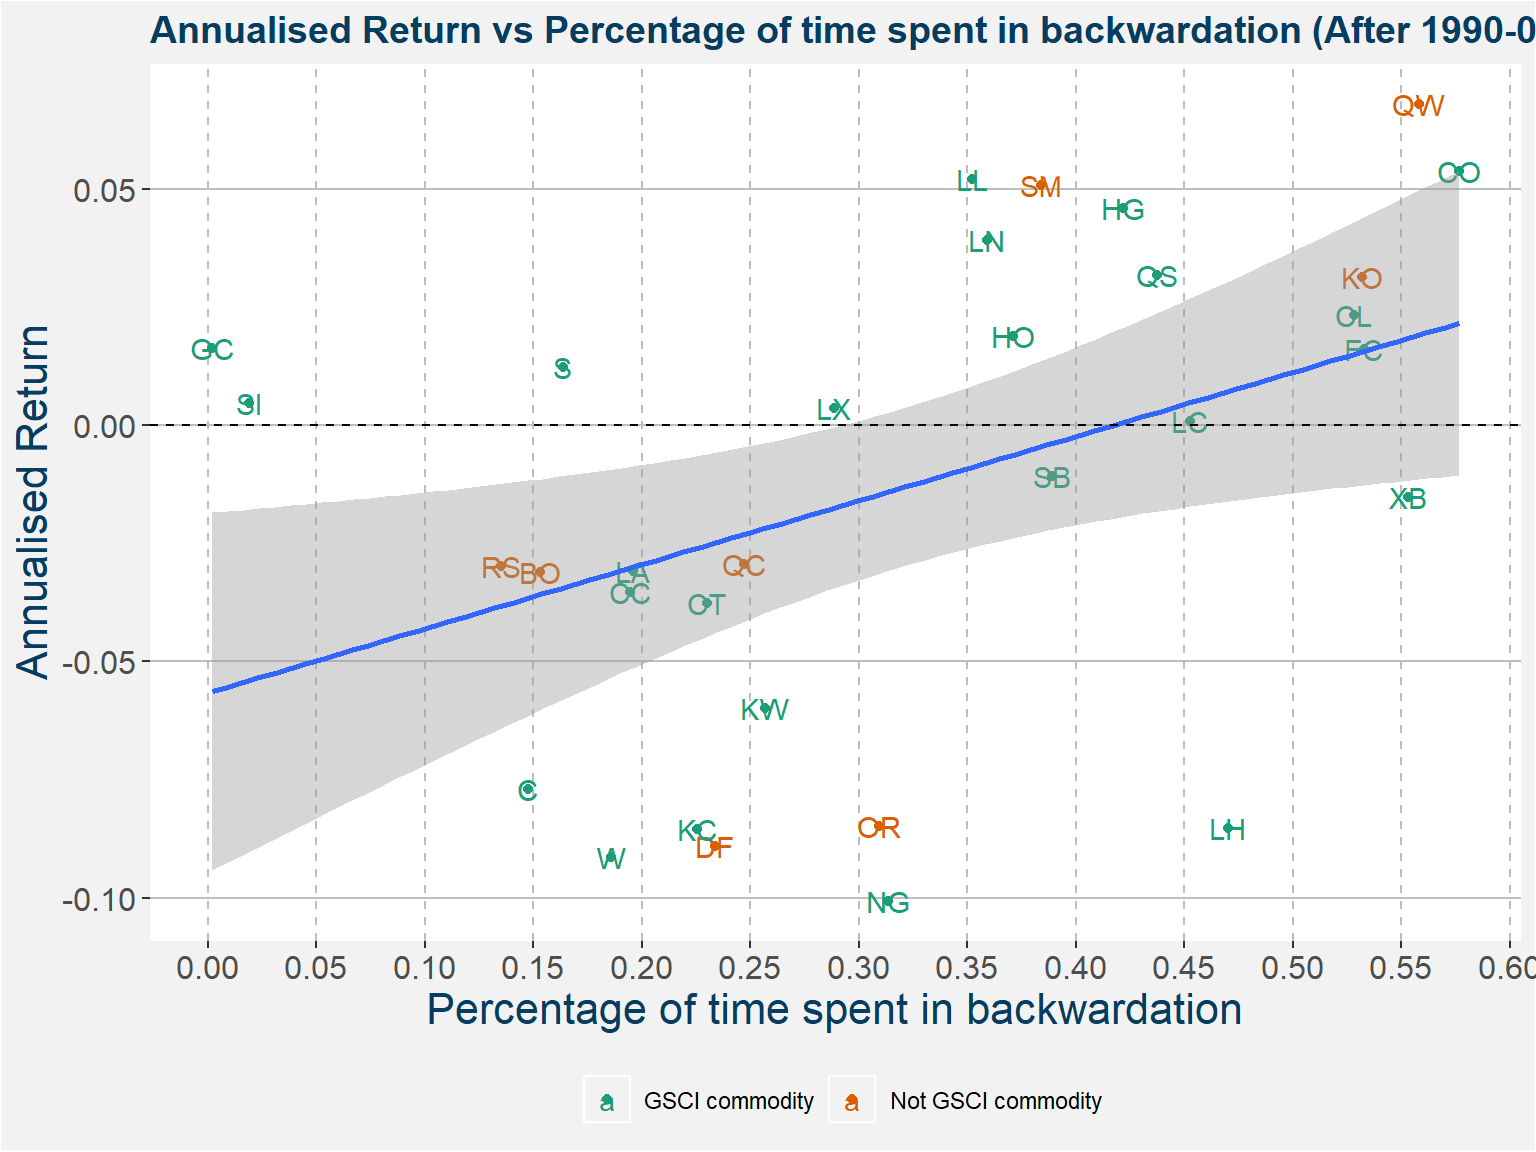
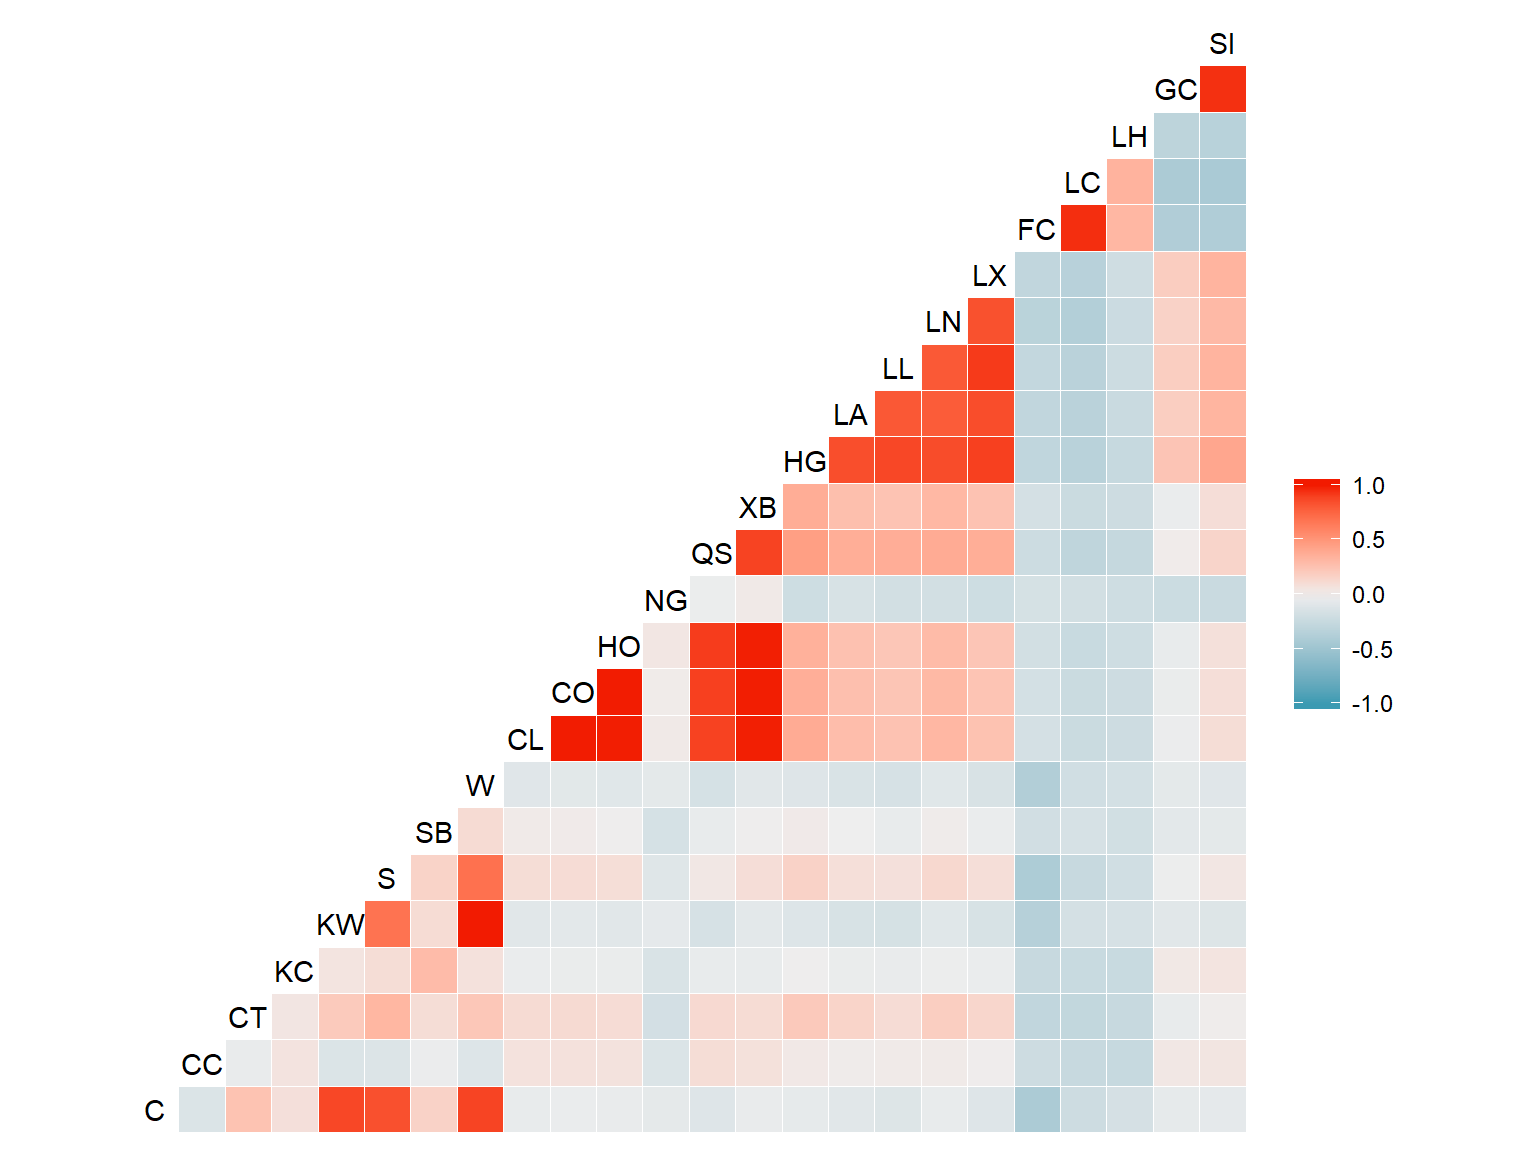
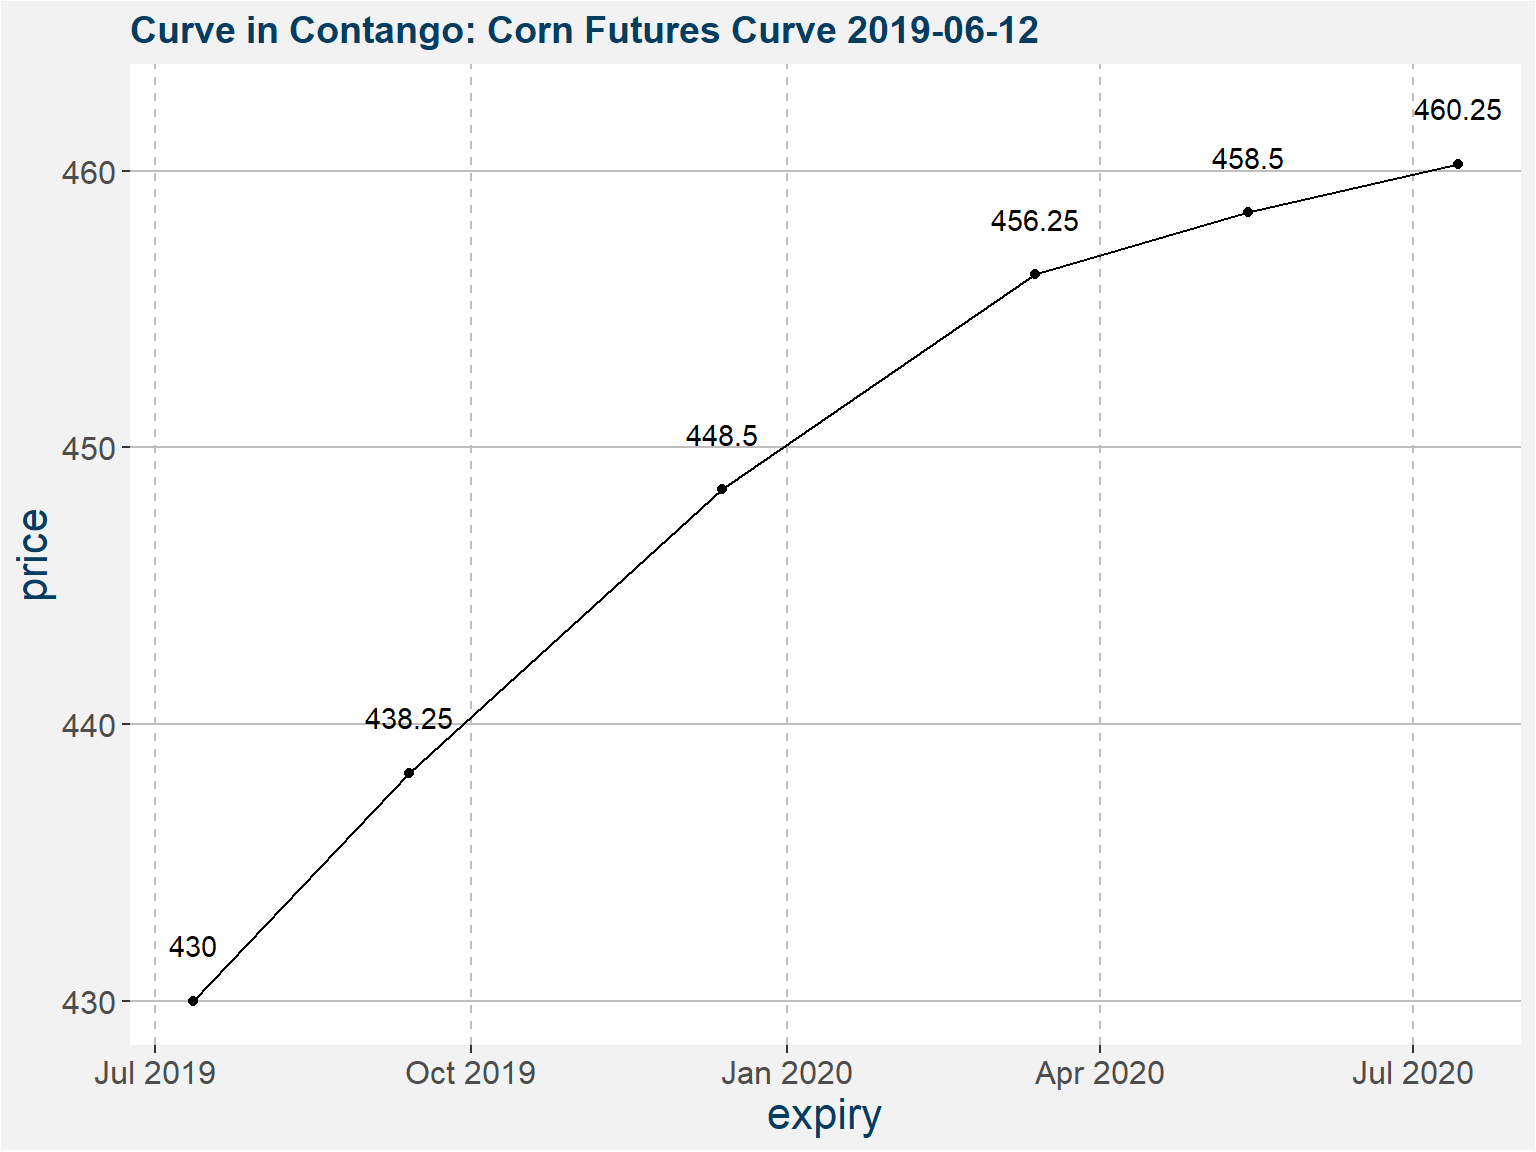
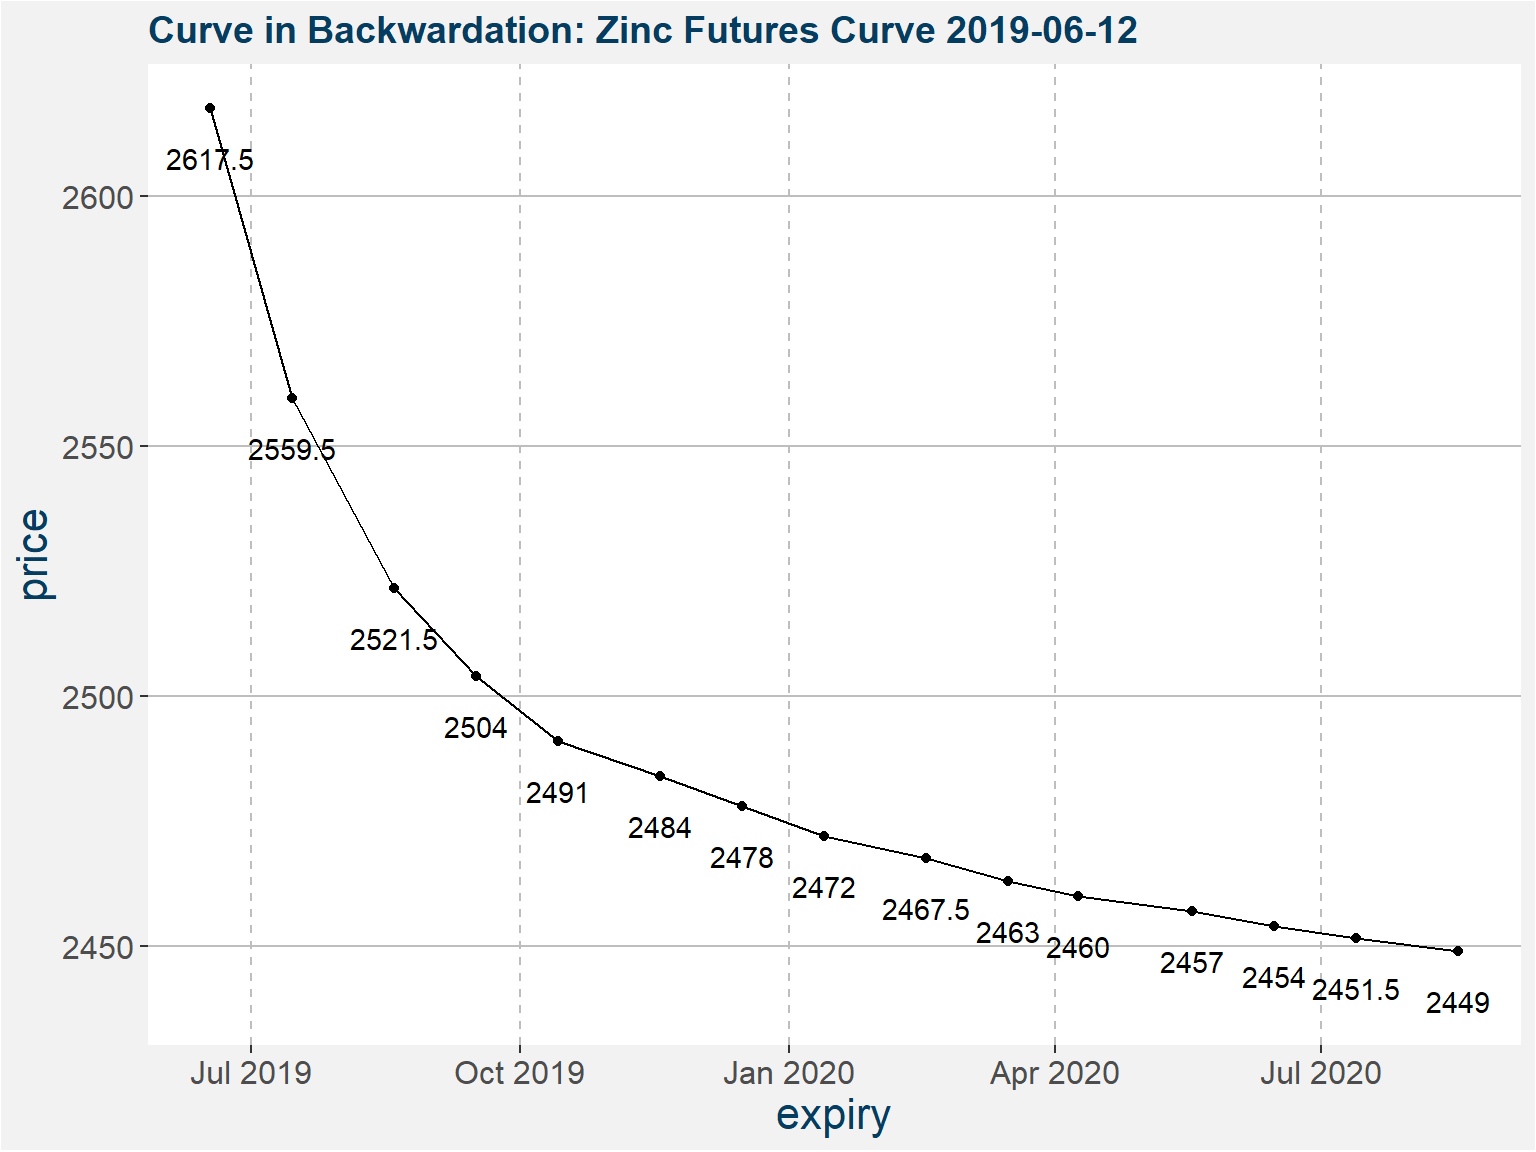
\[ S_{C,K} := P_{C,K} - P_{C,K'} \]
for each commodity \(C\) as the price difference between the front contract \(K\) and deferred contract, twelve months out from the front contract, \(K'\).
| Risk/Reward Statistics | |
|---|---|
| Sharpe Ratio | 0.70 |
| Sortino Ratio | 1.09 |
| Omega Ratio | 0.89 |
| Skewness | 0.39 |
| Kurtosis | 1.99 |
| Risk Statistics | |
|---|---|
| Annualized Std.Deviation | 9.45 |
| Maximum Drawdown | 15.87 |
| Month to Recover | 35.00 |
| Worst Month | -9.19 |
| Losing Months (%) | 43.68 |
| Average Losing Month | -1.47 |
| Loss Deviation | 1.75 |
| Return Statistics | |
|---|---|
| Last Month | 0.09 |
| Year To Date | 0.09 |
| 3 Month ROR | 5.70 |
| 12 Month ROR | 5.63 |
| 36 Month ROR | 15.76 |
| Total Return | 537.43 |
| Compound ROR | 6.60 |
| Best Month | 10.03 |
| Winning Months (%) | 56.32 |
Time Window Analysis:
| 1 Month | 3 Month | 6 Month | 1 Year | 2 Year | 3 Year | 5 Year | |
|---|---|---|---|---|---|---|---|
| Best | 10.03 | 21.52 | 25.19 | 54.59 | 82.57 | 97.21 | 156.07 |
| Worst | -9.19 | -9.91 | -9.73 | -12.58 | -15.60 | -11.70 | -6.92 |
| Average | 0.57 | 1.73 | 3.50 | 7.40 | 16.15 | 25.56 | 50.41 |
| Median | 0.17 | 0.48 | 0.99 | 2.39 | 8.23 | 21.94 | 41.97 |
| Last | 0.09 | 5.70 | 2.84 | 5.63 | 5.93 | 15.76 | 14.08 |
| Winning (%) | 56.32 | 58.09 | 60.35 | 66.77 | 76.00 | 82.75 | 89.62 |
| Avg. Pos. Period | 2.15 | 4.50 | 7.53 | 12.93 | 22.83 | 32.00 | 56.58 |
| Avg. Neg. Period | -1.47 | -2.10 | -2.63 | -3.73 | -5.02 | -5.33 | -2.91 |
| # Of Periods | 348.00 | 346.00 | 343.00 | 337.00 | 325.00 | 313.00 | 289.00 |
Drawdown Report:
| Depth (%) | Length (Months) | Recovery (Months) | Start | End |
|---|---|---|---|---|
| -15.87 | 35 | 8 | 1997-01-31 | 1999-11-30 |
| -13.66 | 53 | 27 | 1991-11-29 | 1996-03-29 |
| -13.43 | 9 | 7 | 2003-03-31 | 2003-11-28 |
| -12.71 | 46 | 21 | 2014-07-31 | 2018-04-30 |
| -10.65 | 22 | 8 | 2000-12-29 | 2002-09-30 |
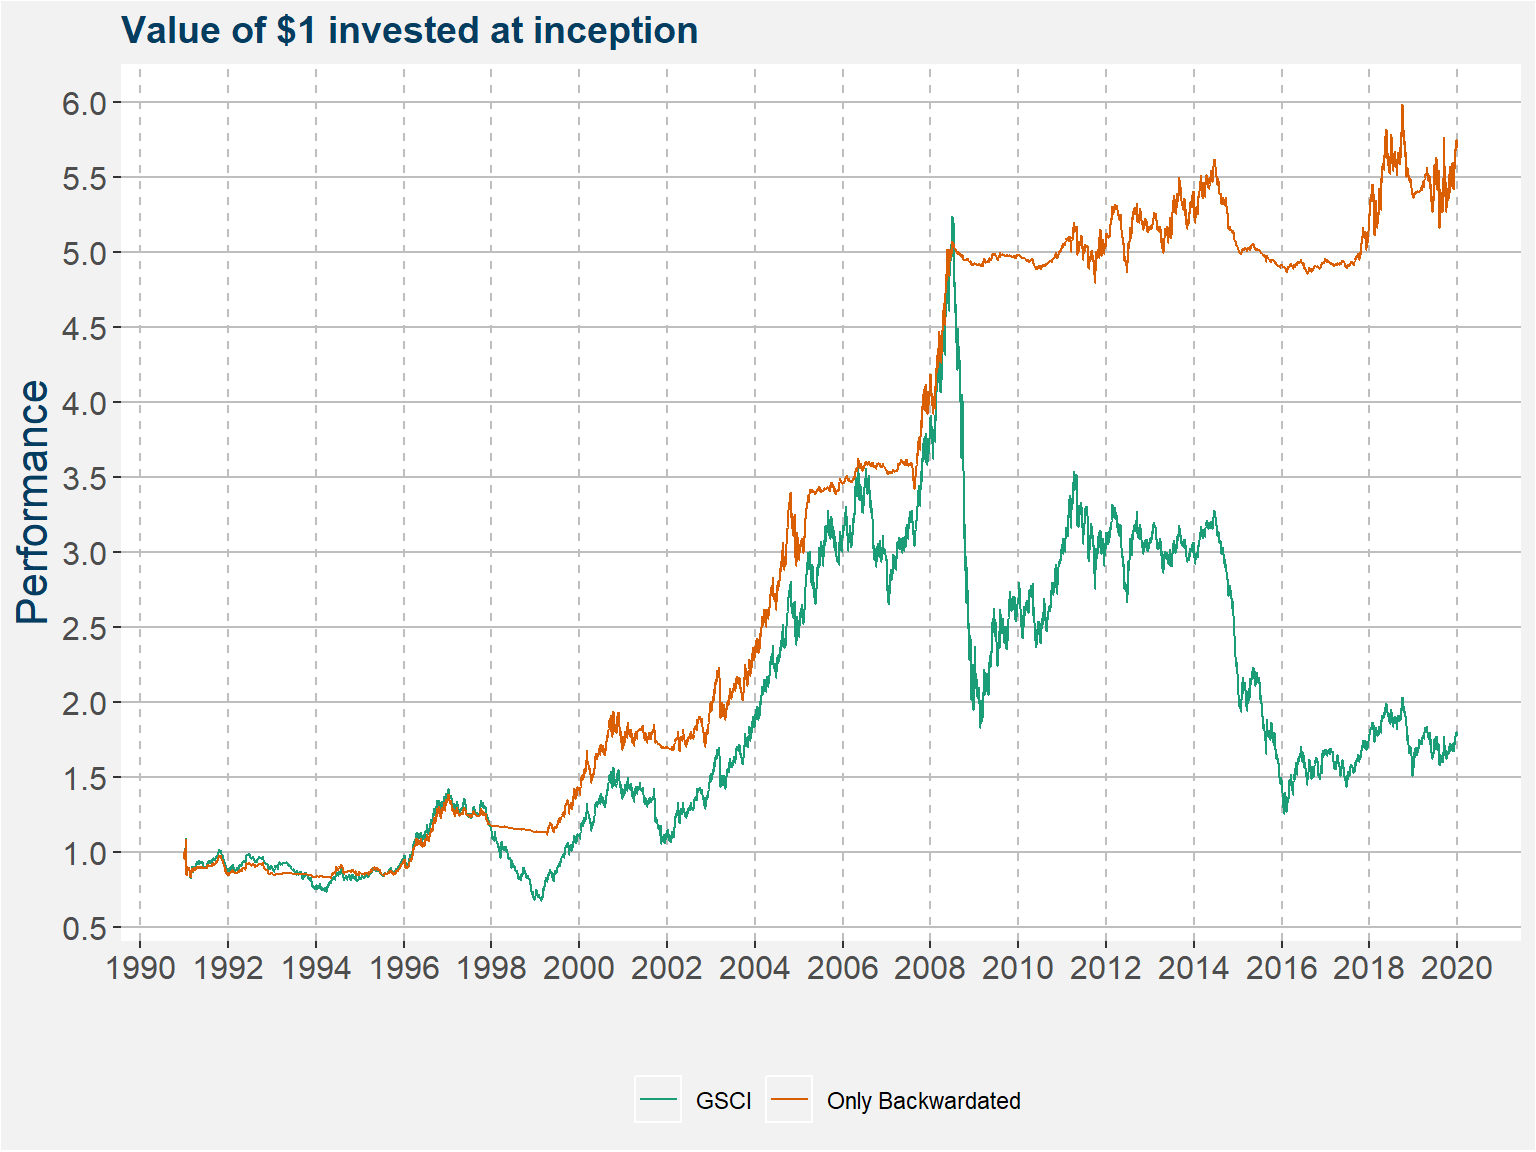
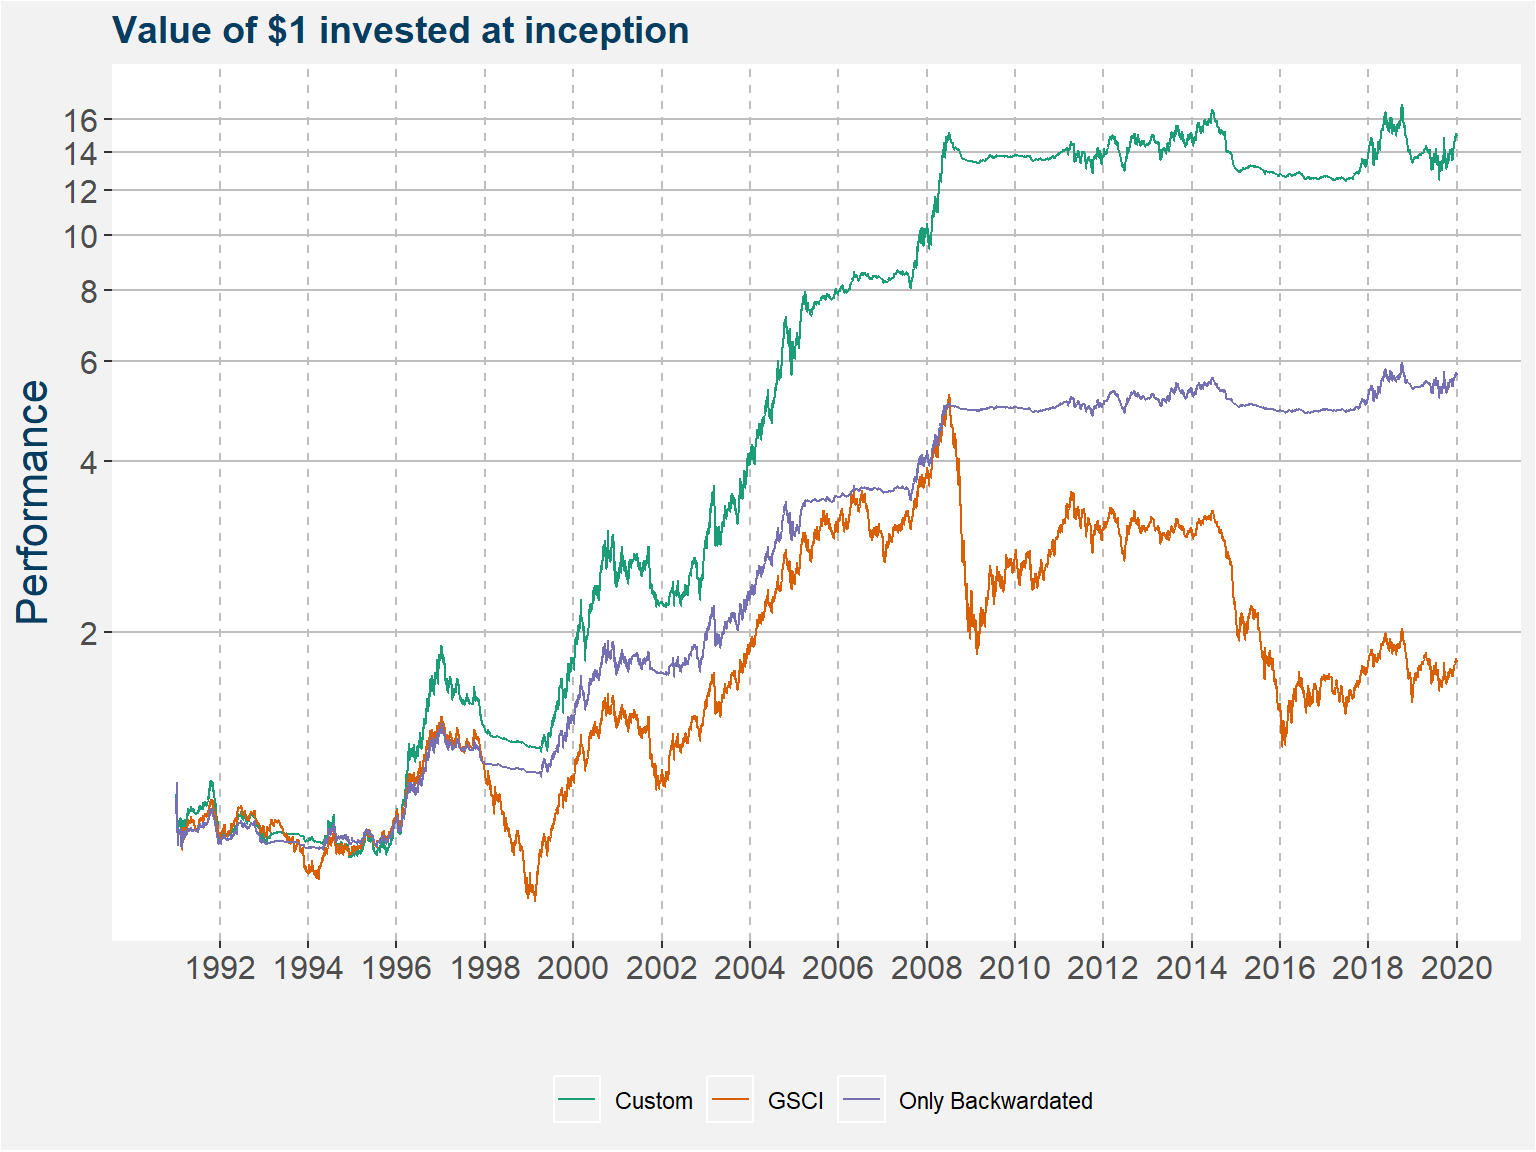
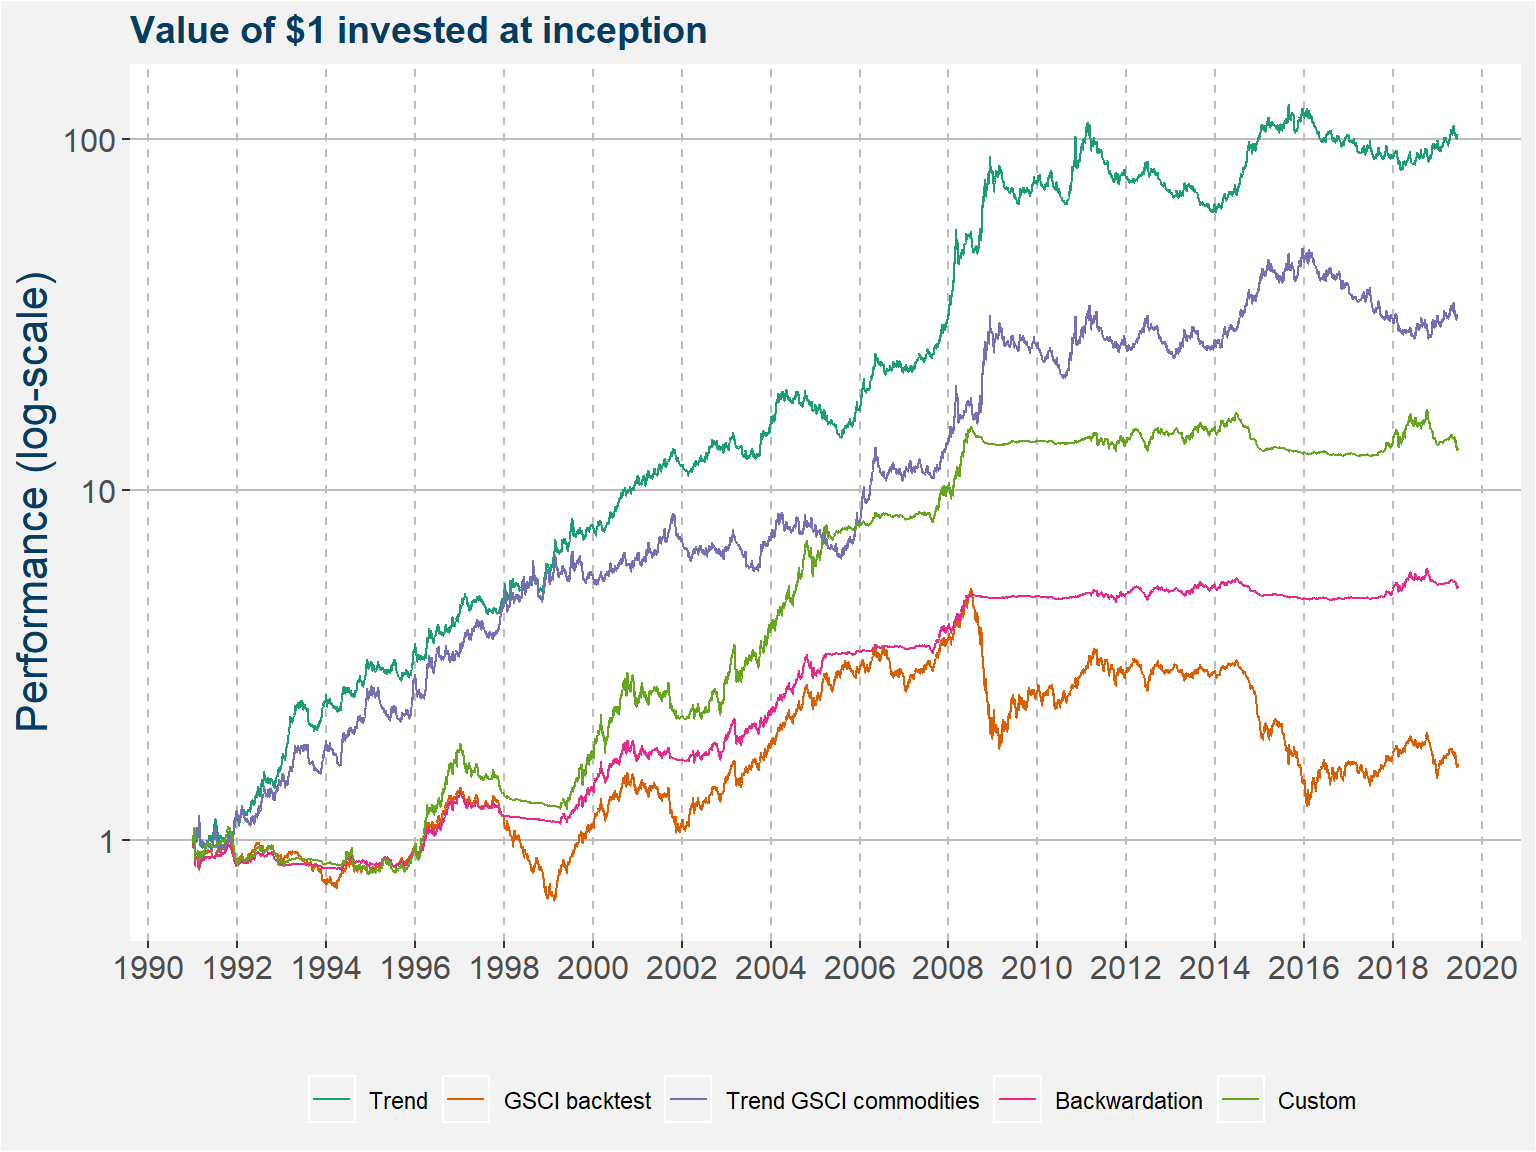
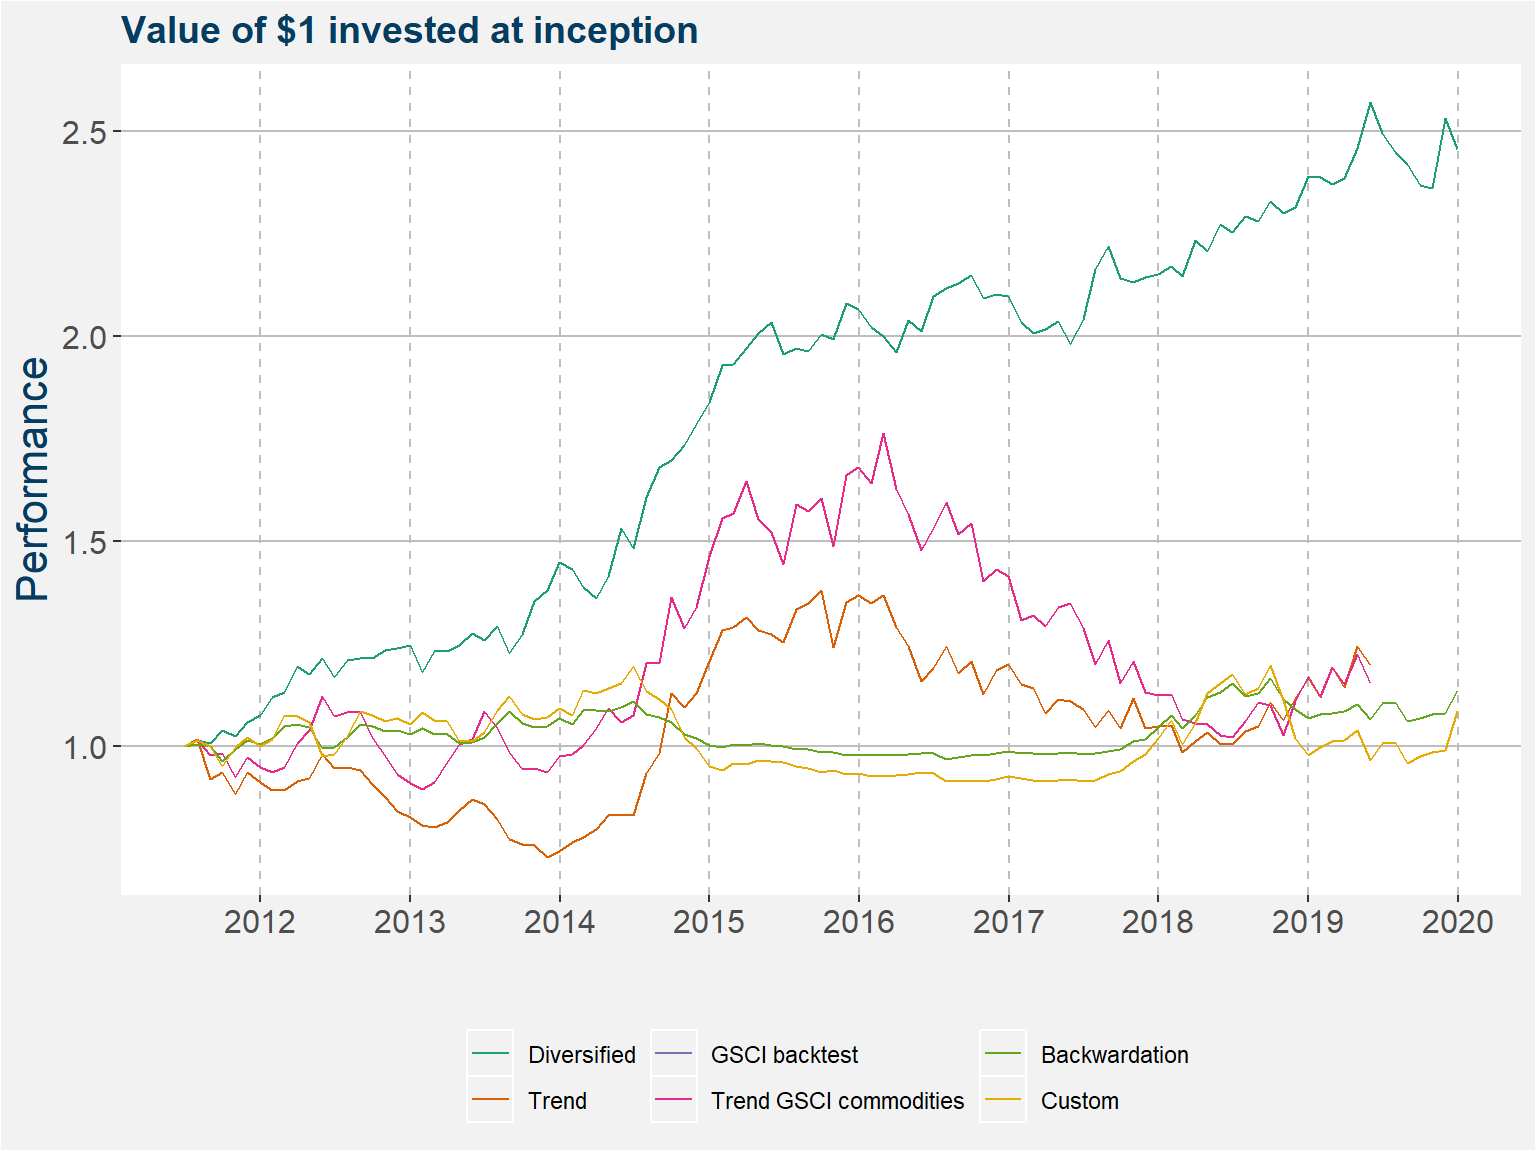
Here we combine the three ideas
| Risk/Reward Statistics | |
|---|---|
| Sharpe Ratio | 0.60 |
| Sortino Ratio | 0.96 |
| Omega Ratio | 0.76 |
| Skewness | 0.40 |
| Kurtosis | 1.64 |
| Risk Statistics | |
|---|---|
| Annualized Std.Deviation | 18.09 |
| Maximum Drawdown | 32.45 |
| Month to Recover | 68.00 |
| Worst Month | -15.67 |
| Losing Months (%) | 43.97 |
| Average Losing Month | -2.98 |
| Loss Deviation | 3.28 |
| Return Statistics | |
|---|---|
| Last Month | 0.26 |
| Year To Date | 0.26 |
| 3 Month ROR | 12.89 |
| 12 Month ROR | 10.33 |
| 36 Month ROR | 16.88 |
| Total Return | 1929.89 |
| Compound ROR | 10.94 |
| Best Month | 19.27 |
| Winning Months (%) | 56.03 |
Time Window Analysis:
| 1 Month | 3 Month | 6 Month | 1 Year | 2 Year | 3 Year | 5 Year | |
|---|---|---|---|---|---|---|---|
| Best | 19.27 | 48.37 | 65.35 | 120.02 | 215.27 | 284.27 | 539.74 |
| Worst | -15.67 | -26.13 | -28.48 | -27.68 | -31.95 | -32.45 | -27.44 |
| Average | 1.00 | 3.09 | 6.33 | 14.07 | 32.69 | 53.51 | 119.23 |
| Median | 0.33 | 0.88 | 1.50 | 2.88 | 10.35 | 36.73 | 77.31 |
| Last | 0.26 | 12.89 | 9.25 | 10.33 | -1.45 | 16.88 | 13.39 |
| Winning (%) | 56.03 | 56.07 | 58.02 | 56.08 | 67.08 | 76.04 | 79.24 |
| Avg. Pos. Period | 4.13 | 9.01 | 15.41 | 31.29 | 53.86 | 74.40 | 154.21 |
| Avg. Neg. Period | -2.98 | -4.46 | -6.21 | -7.93 | -10.45 | -12.78 | -14.32 |
| # Of Periods | 348.00 | 346.00 | 343.00 | 337.00 | 325.00 | 313.00 | 289.00 |
Drawdown Report:
| Depth (%) | Length (Months) | Recovery (Months) | Start | End |
|---|---|---|---|---|
| -32.45 | 68 | NA | 2014-07-31 | NA |
| -32.44 | 37 | 10 | 1997-01-31 | 2000-01-31 |
| -26.08 | 26 | 12 | 2000-12-29 | 2003-01-31 |
| -24.50 | 53 | 14 | 1991-11-29 | 1996-03-29 |
| -19.20 | 9 | 7 | 2003-03-31 | 2003-11-28 |
| Risk/Reward Statistics | |
|---|---|
| Sharpe Ratio | 0.55 |
| Sortino Ratio | 1.23 |
| Omega Ratio | 0.64 |
| Skewness | 0.98 |
| Kurtosis | 2.75 |
| Risk Statistics | |
|---|---|
| Annualized Std.Deviation | 23.44 |
| Maximum Drawdown | 42.13 |
| Month to Recover | 41.00 |
| Worst Month | -12.85 |
| Losing Months (%) | 46.04 |
| Average Losing Month | -4.17 |
| Loss Deviation | 3.02 |
| Return Statistics | |
|---|---|
| Last Month | 0.66 |
| Year To Date | -0.78 |
| 3 Month ROR | 0.82 |
| 12 Month ROR | 13.73 |
| 36 Month ROR | -24.21 |
| Total Return | 3003.21 |
| Compound ROR | 12.85 |
| Best Month | 32.35 |
| Winning Months (%) | 53.96 |
Time Window Analysis:
| 1 Month | 3 Month | 6 Month | 1 Year | 2 Year | 3 Year | 5 Year | |
|---|---|---|---|---|---|---|---|
| Best | 32.35 | 65.19 | 78.93 | 104.30 | 151.85 | 249.49 | 287.80 |
| Worst | -12.85 | -18.22 | -23.14 | -25.26 | -39.65 | -35.82 | -5.86 |
| Average | 1.23 | 3.69 | 7.58 | 15.62 | 33.31 | 55.17 | 109.09 |
| Median | 0.49 | 2.58 | 5.02 | 11.92 | 29.69 | 49.70 | 79.58 |
| Last | 0.66 | 0.82 | -0.78 | 13.73 | -9.90 | -24.21 | 7.84 |
| Winning (%) | 53.96 | 59.59 | 61.90 | 70.00 | 81.76 | 85.29 | 97.87 |
| Avg. Pos. Period | 5.84 | 10.65 | 17.17 | 26.75 | 44.23 | 67.45 | 111.55 |
| Avg. Neg. Period | -4.17 | -6.58 | -8.01 | -10.35 | -15.64 | -16.02 | -4.18 |
| # Of Periods | 341.00 | 339.00 | 336.00 | 330.00 | 318.00 | 306.00 | 282.00 |
Drawdown Report:
| Depth (%) | Length (Months) | Recovery (Months) | Start | End |
|---|---|---|---|---|
| -42.13 | 41 | NA | 2016-03-31 | NA |
| -28.57 | 29 | 7 | 2001-11-30 | 2004-03-31 |
| -25.79 | 22 | 5 | 2009-03-31 | 2010-12-31 |
| -25.67 | 41 | 20 | 2011-05-31 | 2014-09-30 |
| -25.02 | 22 | 6 | 2004-04-30 | 2006-01-31 |
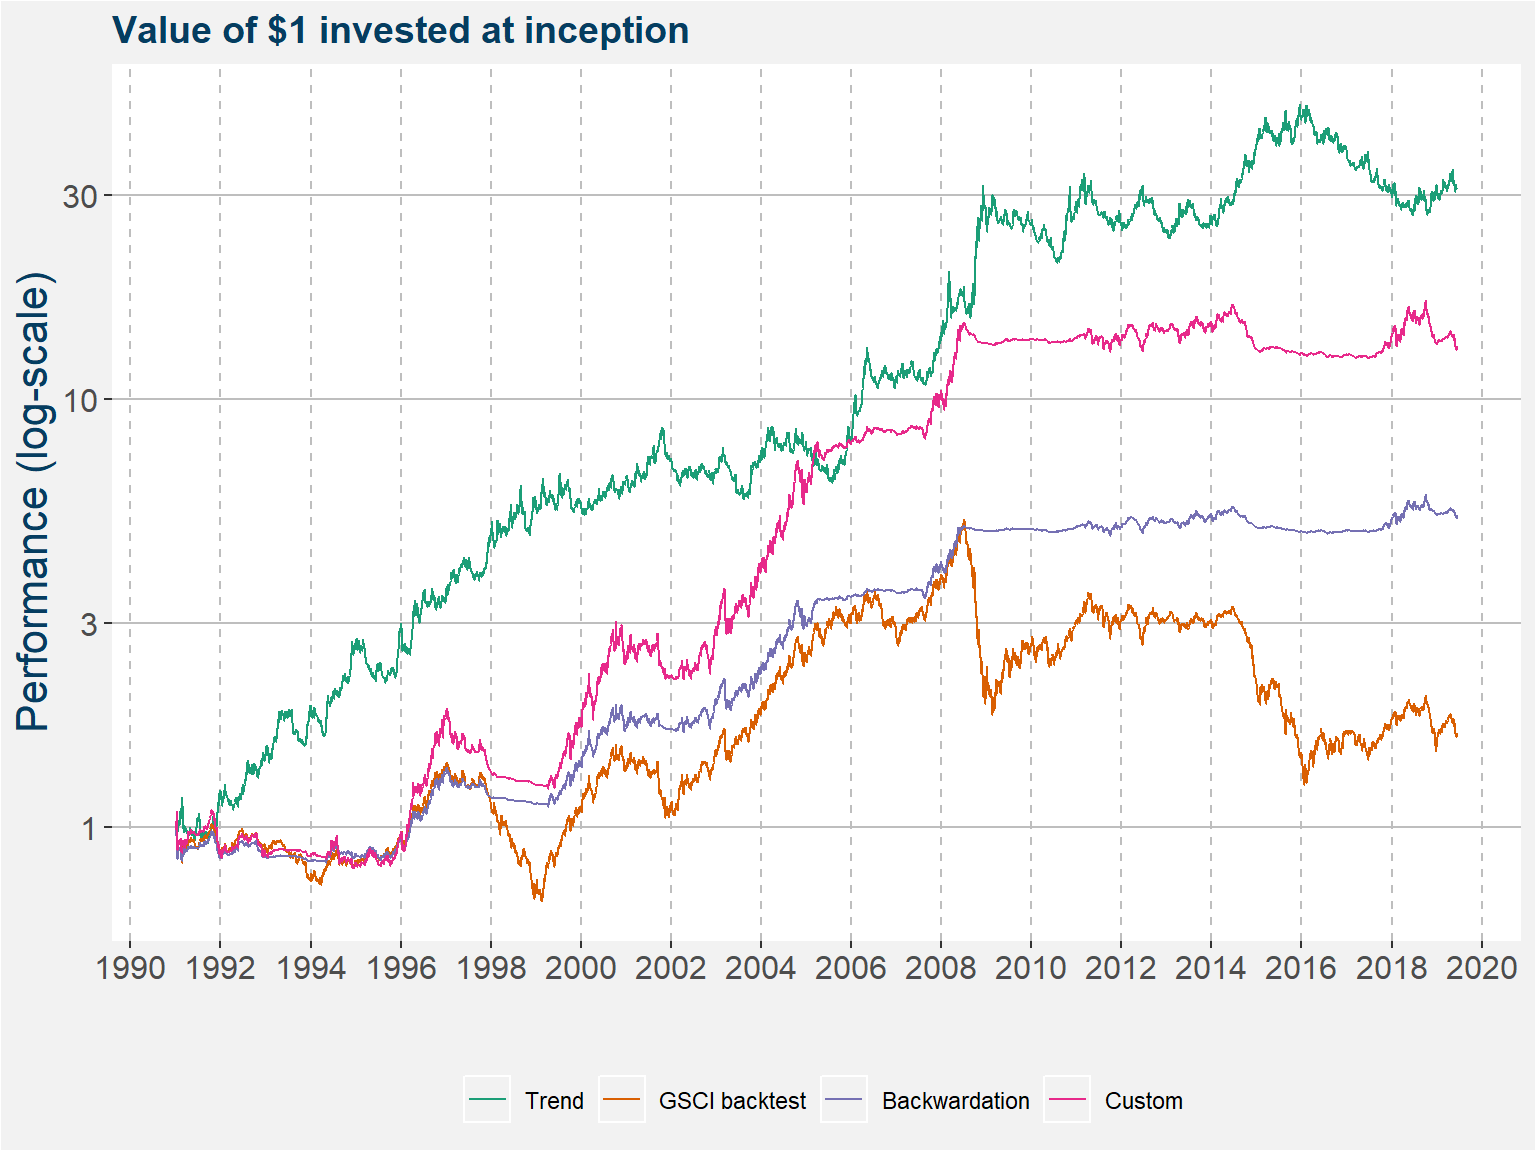
Use the Polar Star Trend System on an extended universe of commodities
Diversification added by
| Risk/Reward Statistics | |
|---|---|
| Sharpe Ratio | 0.82 |
| Sortino Ratio | 1.95 |
| Omega Ratio | 1.03 |
| Skewness | 1.53 |
| Kurtosis | 7.20 |
| Risk Statistics | |
|---|---|
| Annualized Std.Deviation | 21.68 |
| Maximum Drawdown | 41.79 |
| Month to Recover | 47.00 |
| Worst Month | -11.32 |
| Losing Months (%) | 43.11 |
| Average Losing Month | -3.48 |
| Loss Deviation | 2.62 |
| Return Statistics | |
|---|---|
| Last Month | 0.59 |
| Year To Date | 3.16 |
| 3 Month ROR | 5.23 |
| 12 Month ROR | 19.71 |
| 36 Month ROR | 1.18 |
| Total Return | 10227.97 |
| Compound ROR | 17.73 |
| Best Month | 44.08 |
| Winning Months (%) | 56.89 |
Time Window Analysis:
| 1 Month | 3 Month | 6 Month | 1 Year | 2 Year | 3 Year | 5 Year | |
|---|---|---|---|---|---|---|---|
| Best | 44.08 | 84.24 | 116.12 | 165.97 | 272.37 | 367.65 | 469.46 |
| Worst | -11.32 | -15.25 | -26.58 | -28.72 | -35.94 | -37.96 | -19.35 |
| Average | 1.55 | 4.79 | 9.96 | 21.13 | 46.60 | 77.05 | 155.78 |
| Median | 1.08 | 3.58 | 7.85 | 17.71 | 39.30 | 64.06 | 147.07 |
| Last | 0.59 | 5.23 | 3.16 | 19.71 | 10.30 | 1.18 | 44.71 |
| Winning (%) | 56.89 | 64.31 | 69.05 | 74.24 | 84.28 | 87.91 | 97.16 |
| Avg. Pos. Period | 5.37 | 10.59 | 17.90 | 31.87 | 58.18 | 90.04 | 160.69 |
| Avg. Neg. Period | -3.48 | -5.68 | -7.78 | -9.83 | -15.49 | -17.39 | -12.35 |
| # Of Periods | 341.00 | 339.00 | 336.00 | 330.00 | 318.00 | 306.00 | 282.00 |
Drawdown Report:
| Depth (%) | Length (Months) | Recovery (Months) | Start | End |
|---|---|---|---|---|
| -41.79 | 47 | 14 | 2011-03-31 | 2015-01-30 |
| -28.64 | 46 | NA | 2015-10-30 | NA |
| -26.48 | 18 | 6 | 2004-08-31 | 2006-01-31 |
| -19.32 | 20 | 2 | 2009-03-31 | 2010-10-29 |
| -15.87 | 7 | 3 | 1993-06-30 | 1993-12-31 |
| Risk/Reward Statistics | |
|---|---|
| Sharpe Ratio | 1.14 |
| Sortino Ratio | 2.46 |
| Omega Ratio | 1.31 |
| Skewness | 0.28 |
| Kurtosis | 0.23 |
| Risk Statistics | |
|---|---|
| Annualized Std.Deviation | 9.77 |
| Maximum Drawdown | 8.21 |
| Month to Recover | 8.00 |
| Worst Month | -5.32 |
| Losing Months (%) | 38.24 |
| Average Losing Month | -1.85 |
| Loss Deviation | 1.31 |
| Return Statistics | |
|---|---|
| Last Month | -2.91 |
| Year To Date | 2.85 |
| 3 Month ROR | 3.71 |
| 12 Month ROR | 2.85 |
| 36 Month ROR | 17.14 |
| Total Return | 145.78 |
| Compound ROR | 11.16 |
| Best Month | 8.36 |
| Winning Months (%) | 61.76 |
Time Window Analysis:
| 1 Month | 3 Month | 6 Month | 1 Year | 2 Year | 3 Year | 5 Year | |
|---|---|---|---|---|---|---|---|
| Best | 8.36 | 14.51 | 24.89 | 45.02 | 63.57 | 73.66 | 111.46 |
| Worst | -5.32 | -6.12 | -6.12 | -2.62 | -2.56 | 9.95 | 33.58 |
| Average | 0.92 | 2.80 | 5.70 | 11.74 | 25.38 | 41.28 | 75.04 |
| Median | 0.69 | 2.54 | 4.47 | 8.78 | 21.76 | 43.94 | 75.11 |
| Last | -2.91 | 3.71 | -1.55 | 2.85 | 14.24 | 17.14 | 33.58 |
| Winning (%) | 61.76 | 74.00 | 83.51 | 93.41 | 98.73 | 100.00 | 100.00 |
| Avg. Pos. Period | 2.64 | 4.76 | 7.41 | 12.64 | 25.74 | 41.28 | 75.04 |
| Avg. Neg. Period | -1.85 | -2.77 | -2.94 | -1.05 | -2.56 | NaN | NaN |
| # Of Periods | 102.00 | 100.00 | 97.00 | 91.00 | 79.00 | 67.00 | 43.00 |
Drawdown Report:
| Depth (%) | Length (Months) | Recovery (Months) | Start | End |
|---|---|---|---|---|
| -8.21 | 8 | NA | 2019-06-30 | NA |
| -7.82 | 10 | 2 | 2016-10-31 | 2017-07-31 |
| -6.12 | 5 | 2 | 2014-01-31 | 2014-05-31 |
| -5.75 | 7 | 3 | 2015-12-31 | 2016-06-30 |
| -5.32 | 4 | 3 | 2013-01-31 | 2013-04-30 |
| Limited | Quant | Spectrum | |
|---|---|---|---|
| count | 30.00 | 30.00 | 29.00 |
| mean | 2.81 | 2.19 | 4.37 |
| std | 1.97 | 1.99 | 4.43 |
| min | 0.39 | 0.04 | 0.15 |
| 25% | 1.08 | 0.90 | 1.20 |
| 50% | 2.48 | 1.71 | 2.85 |
| 75% | 3.57 | 2.64 | 6.30 |
| max | 7.41 | 7.66 | 16.68 |
| number of months | 60.00 | 60.00 | 55.00 |
| Positve Percentage | 50.00 | 50.00 | 52.73 |
| Equilibrium Weight | 38.20 | 36.80 | 25.10 |